
NPCS has been helping entrepreneurs, startups, MSMEs, and industrial investors since 1992 with detailed project reports, feasibility studies, market research, and business consulting services across 50+ industries.
India's farms cannot function without a steady supply of nutrients, and that single fact keeps pulling new manufacturing business ideas into the fertilizer space. Every kharif and rabi season, millions of farmers queue up for urea, DAP, SSP and NPK blends, and every season, the gap between what factories produce and what fields need gets a fresh headline. For an entrepreneur weighing manufacturing business ideas right now, fertilizers sit in a rare category: demand is guaranteed by biology, prices are cushioned by subsidy, and large parts of the value chain are still open to small and mid-sized producers.
Food security is not optional for any government, and that keeps fertilizer demand unusually stable compared to most industrial goods. India feeds well over a billion people from a shrinking per-capita landholding, so every hectare has to work harder. Balanced nutrition through nitrogen, phosphorus, potassium and micronutrients is the fastest lever farmers have to raise yield, which is exactly why consumption keeps climbing even in years when other industrial sectors slow down.
The timing also favours new entrants. Import dependence on phosphatic fertilizers has spiked over the past two years, and the government is actively courting domestic producers to fill that gap rather than lean further on Chinese, Saudi or Moroccan supply.
|
India's urea imports jumped from 48.70 lakh tonnes to 89.30 lakh tonnes between April and January across FY2025 and FY2026 — an 83% rise, according to Ministry of Chemicals and Fertilizers data. |
That kind of swing is not a one-off. It reflects a structural gap between what Indian plants can produce and what 350 lakh tonnes of annual urea demand actually requires, and it is the same gap that drives opportunity in DAP, NPK and SSP manufacturing.
Demand for fertilizer in India breaks down unevenly across nutrients, and understanding that split matters more than looking at the headline market size. Nitrogenous fertilizers, led by urea, account for the largest revenue share of the market — industry estimates put it above 40% — because rice and wheat cultivation across the Indo-Gangetic belt runs on nitrogen. Phosphatic and potassic fertilizers come next, with DAP as the dominant product, though India imports the bulk of its phosphoric acid and rock phosphate feedstock.
Micronutrient and specialty fertilizers are the fastest-growing segment by percentage, even if they remain small in absolute size. Continuous rice-wheat-cotton cycles across Punjab, Haryana and western Uttar Pradesh have depleted zinc, boron and iron in the soil faster than nature replaces them, and farmers are now paying for correction rather than treating micronutrients as optional. Horticulture and fertigation-linked demand is growing even faster, roughly 6.5% CAGR by some estimates, as drip irrigation spreads and water-soluble fertilizer blends become standard for fruit, vegetable and flower growers.
End users span everyone from marginal wheat farmers buying subsidised urea bags to export-oriented horticulture operations buying premium water-soluble NPK. That breadth is what makes this a business ideas category rather than a single product line — an entrepreneur can enter through commodity urea trading and blending, through SSP manufacturing, or through a tighter niche like water-soluble fertilizers for drip systems.
Central government support for this sector is unusually deep, and that changes the risk profile for a new manufacturing unit. Urea remains fully price-controlled, sold to farmers at Rs. 266–276 per 45-kg bag, with the government absorbing the gap between production cost and retail price directly through manufacturers. Phosphatic and potassic fertilizers run on the Nutrient Based Subsidy (NBS) scheme instead, where the subsidy is fixed per kilogram of nitrogen, phosphorus, potassium and sulphur content rather than per product. The Kharif 2026 NBS outlay of Rs. 41,534 crore, covering 28 P&K fertilizer grades including DAP, MOP and NPKS blends, was set roughly 11–12% higher than the previous cycle to offset rising global input costs.
On the capacity side, the Cabinet's National Investment Policy for Urea-2026 (NIPU-2026) is designed to pull in 8–9 new gas-based urea plants and add close to 10 million tonnes of fresh domestic capacity, with uniform incentives extended across public sector, private sector and cooperative projects. The One Nation One Fertilizer scheme, which requires all subsidised urea to carry the common Bharat brand, has also standardised market access so smaller manufacturers are not competing purely on brand recall.
MSME-scale entrants can layer in broader support too. Working capital and term loans for fertilizer blending or SSP units typically qualify for collateral-free backing under CGTMSE, and technology upgradation support under schemes linked to the erstwhile CLCSS framework helps offset the cost of automation and quality-testing equipment. State industrial policies add another layer — Gujarat's Industrial Policy 2026, for instance, offers MSME chemical and fertilizer units a combination of capital subsidy, interest subsidy and power tariff support that can cover 25–45% of eligible fixed capital investment depending on the taluka, which matters given Gujarat already hosts GSFC, GNFC and several private SSP and NPK units.
Growth in this sector is driven less by discretionary spending and more by three hard constraints: shrinking arable land per farmer, static or falling soil fertility, and a national target to keep raising foodgrain output. Each of those pushes fertilizer consumption up even when the broader economy cools.
Policy is reinforcing that pull rather than fighting it. The NBS framework's 2024 shift from a product-centric to a nutrient-centric subsidy model has already tilted farmer demand toward balanced, complex NPK grades instead of straight urea, which is good news for blending and complex-fertilizer manufacturers rather than single-product urea plants. Nano-fertilizer adoption, still early but scaling fast through IFFCO's nano urea and nano DAP lines, is reshaping unit economics for the whole industry by cutting the freight, storage and application cost per unit of nutrient delivered. Meanwhile, expanding drip and sprinkler irrigation is steadily pulling water-soluble and specialty fertilizers into mainstream use rather than leaving them as a niche horticulture product.
|
Year |
Market Size (USD Billion) |
Status |
|
2022 |
~20.0 |
Estimated (trend-based) |
|
2023 |
~21.2 |
Estimated (trend-based) |
|
2024 |
~22.5 |
Estimated (trend-based) |
|
2025 |
23.80 |
Industry estimate |
|
2026 |
25.30 |
Industry estimate |
|
2031 (F) |
34.34 |
Forecast, industry estimate |
|
2035 (F) |
~43.4 |
Forecast, assumed at 6.08% CAGR held constant beyond 2031 |
Note: figures for 2022–2024 and 2035 are extrapolated using the reported 6.08% CAGR and should be read as directional estimates, not audited industry statistics. Reported figures vary by research house depending on scope (chemical-only versus chemical-plus-biofertilizer), so treat absolute values as indicative of scale and direction rather than a single verified number.
Assuming the current 6.08% CAGR broadly holds — itself an assumption, since subsidy policy and global input prices can shift that number in either direction — India's fertilizer market could cross USD 43 billion by 2035, roughly 1.7 times its 2026 size. Volume growth will likely trail value growth, because a growing share of that revenue is expected to come from higher-margin complex, specialty and nano formulations rather than tonnage of straight urea.
Three forces will decide whether that forecast holds. First, whether NIPU-2026's new urea capacity actually comes online on schedule and closes the import gap. Second, whether domestic phosphoric acid and rock phosphate capacity expands fast enough to reduce DAP import dependence, which today sits above 60 lakh tonnes annually. Third, how quickly nano and water-soluble formats scale beyond their current early-adopter base among horticulture and export-oriented farmers.
India's trade position in fertilizers is lopsided, and that imbalance is exactly where new manufacturing capacity finds its opening. On urea, imports surged to over 10 million tonnes in FY2025-26 even as domestic capacity additions were underway, because seasonal demand spikes still outrun local production during peak kharif and rabi sowing windows. On DAP, India signed long-term supply agreements for 3.1 million tonnes a year from Saudi Arabia's Maaden starting FY2025-26, alongside annual commitments of 30.10 lakh tonnes from Russia and 25 lakh tonnes from Morocco, precisely because China-sourced DAP volumes have been falling — from 22.28 lakh tonnes in FY2023-24 to 8.47 lakh tonnes in FY2024-25.
|
SSP production climbed 9.5% and sales rose 15% between April and November 2025, government-linked industry data shows — a sign that India's homegrown, phosphate-efficient fertilizer is gaining share against imported DAP. |
That SSP trend line is worth sitting with. Unlike DAP, single super phosphate uses domestically available rock phosphate more efficiently and does not depend on imported ammonia, which makes it one of the more insulated segments for a new manufacturer to enter without exposure to global freight and currency risk. On the export side, India's fertilizer trade remains overwhelmingly import-facing rather than export-facing, so the near-term opportunity for most new entrants sits in import substitution — feeding blending and complex-fertilizer plants with domestic or diversified-import feedstock — rather than in outbound trade.
|
Company |
Note |
|
Indian Farmers Fertiliser Cooperative (IFFCO) |
Cooperative sector leader; pioneered nano urea and nano DAP at commercial scale |
|
Coromandel International (Murugappa Group) |
India's largest private phosphatic fertilizer producer, strong South India retail network |
|
Chambal Fertilisers and Chemicals |
Largest private-sector urea manufacturer; also a major DAP importer and trader |
|
Gujarat State Fertilizers & Chemicals (GSFC) |
Gujarat-based public sector unit, strong in specialty and water-soluble grades |
|
Gujarat Narmada Valley Fertilizers & Chemicals (GNFC) |
State-owned; large integrated chemical-fertilizer complex in Gujarat |
|
Rashtriya Chemicals & Fertilizers (RCF) |
Public sector urea and complex fertilizer producer, western and northern India presence |
|
National Fertilizers Limited (NFL) |
Public sector urea major with a pan-India dealer network |
|
Deepak Fertilisers & Petrochemicals (DFPCL) |
Private player focused on specialty, water-soluble and customised nutrient blends |
Three structural trends make this sector worth a serious look rather than a passing glance. The subsidy-linked demand floor means a manufacturer's biggest revenue risk — a farmer simply not buying — is dampened by policy in a way few other industrial categories enjoy. The ongoing shift from straight to complex and specialty fertilizers means margin per tonne is trending up, not down, for producers who can move beyond commodity urea. And the import-substitution push, backed by NIPU-2026 and an expanding NBS grade list, is actively rewarding new domestic capacity rather than protecting incumbents.
|
EXPERT TAKE Our advisory work with first-time entrants tells us the smartest entry point is rarely the most capital-intensive one. A gas-based urea plant needs hundreds of crores and years of gestation; an SSP, NPK blending or water-soluble fertilizer unit can be commissioned in months on a fraction of that capital, and still rides the same demand tailwinds. |
Regional demand patterns also open room for differentiated positioning. North India's wheat-paddy belt will keep pulling volume-driven urea and DAP demand, but South and West India's horticulture, cotton and oilseed acreage is where specialty, water-soluble and micronutrient fertilizers are growing fastest — a smaller, higher-margin market that rewards focused manufacturers over volume players.
|
Segment |
Indicative Capacity |
Plant & Machinery (Rs. Lakh) |
Approx. Project Cost (Rs. Lakh) |
|
NPK Fertilizer (straight grade blending) |
10 MT/day |
69 |
819 |
|
Water-Soluble Fertilizer (drip-irrigation blends) |
32 MT/day |
87 |
529 |
|
NPK Water-Soluble Fertilizer (multi-grade) |
12,000 kg/day |
234 |
511 |
|
Magnesium Sulphate (fertilizer grade) |
24 MT/day |
147 |
434 |
|
Potassium Schoenite |
3,000 MT/annum |
155 |
689 |
|
Urea from Natural Gas (large scale) |
100 MT/day |
1,598 |
3,300 |
Source: NPCS project database of detailed project reports; figures are representative and will vary by location, machinery vendor and raw material sourcing — treat as a starting reference for feasibility, not a final quote.
A small NPK or water-soluble fertilizer blending unit can be set up with a project cost in the range of Rs. 5–12 lakh for plant and machinery alone, with total project cost, including working capital and civil work, typically landing between Rs. 40 lakh and Rs. 8 crore depending on capacity and product mix.
NPK blending and SSP manufacturing are generally more accessible than urea. Urea production needs a gas feedstock, heavy capital and years of gestation, while blending and SSP units can be commissioned faster, on far lower capital, using established, well-documented processes.
The subsidy is paid to manufacturers and importers, not directly to farmers. Under NBS and the urea price-control mechanism, companies sell at government-fixed rates and claim the cost difference as subsidy, which stabilises manufacturer cash flow as long as reimbursement cycles stay on schedule.
Core requirements include registration under the Fertilizer (Control) Order, 1985, State Pollution Control Board consent to establish and operate, Udyam/MSME registration, GST registration, and BIS certification for specified products such as SSP under IS 12579.
India remains a net importer across urea and DAP, so the stronger near-term opportunity lies in import substitution — supplying the domestic market — rather than export. SSP and specialty water-soluble segments, which rely less on imported feedstock, offer more room to build supply resilience.
Based on NPCS project data across similar-scale blending and SSP units, rates of return in the high-20s to low-30s percent range and break-even points between roughly 35% and 65% of installed capacity are common, though actual figures depend heavily on raw material sourcing and subsidy reimbursement timelines.
Fertilizer manufacturing is not a sector where an entrepreneur bets on discovering new demand — the demand already exists, backed by biology and reinforced by policy. What is genuinely open right now is the supply side: import dependence on urea and DAP that domestic capacity has not yet closed, a subsidy structure that is actively rewarding complex and specialty grades over commodity urea, and state-level incentive frameworks like Gujarat's that make MSME-scale entry meaningfully cheaper than it looks on paper. For a founder deciding where to place capital in Indian manufacturing today, fertilizers offer a rare combination: policy-backed demand, multiple entry points from Rs. 40 lakh upward, and a government actively trying to hand market share to the next domestic producer who shows up ready.
Please choose a project below related to this category.

In the fast-changing agricultural input industry, Potassium Schoenite manufacturing is emerging as a promising business opportunity for startups and e...
|
Capacity : Potassium Schoenite: 3,000 MT Per Annum Magnesium Sulphate Brine (by Product): 2,850 MT Per Annum |
Plant and Machinery cost: 155 |
|
Working Capital : N/A |
Rate of Return (ROR): 30 |
|
Break Even Point (BEP): 59 |
TCI :
|
|
Cost of Project : 689 |
Urea from Natural Gas is a fantastic and new method for the production of fertilizer. In this model, the production of urea is dependent on the natura...
|
Capacity : Urea Fertilizer 100 MT Per Day |
Plant and Machinery cost: 1598 |
|
Working Capital : N/A |
Rate of Return (ROR): 26 |
|
Break Even Point (BEP): 62 |
TCI :
|
|
Cost of Project : 3300 |
Agriculture is the backbone of many economies, and as crops are produced in higher volumes, the need for agrochemicals (such as fertilizers) becomes m...
|
Capacity : NPK Fertilizer (19-19-19) : 1.67 MT per Day NPK Fertilizer (13-40-13) : 1.67 MT per Day NPK Fertilizer (12-61-00) : 1.67 MT per Day NPK Fertilizer (00-52-34) : 1.67 MT per Day NPK Fertilizer (13-00-45) : 1.67 MT per Day NPK Fertilizer (00-00-50) : 1.67 MT per Day |
Plant and Machinery cost: 179 |
|
Working Capital : N/A |
Rate of Return (ROR): 28 |
|
Break Even Point (BEP): 35 |
TCI :
|
|
Cost of Project : 1192 |
Feeding billions of people is a true test of the flexibility and efficiency of farming innovations. NPK Water Soluble Fertilizers have quietly begun t...
|
Capacity : NPK WSF (15:30+2MgO+TE): 12,000 Kgs Per Day NPK WSF (00:09:46+TE): 12,000 Kgs Per Day NPK WSF (00:42:47+TE): 12,000 Kgs Per Day |
Plant and Machinery cost: 234 |
|
Working Capital : N/A |
Rate of Return (ROR): 33 |
|
Break Even Point (BEP): 66 |
TCI :
|
|
Cost of Project : 511 |
NPK (Nitrogen-Phosphorus-Potassium) fertilizers are among the most essential agricultural inputs, providing balanced nutrition to crops. The variant i...
|
Capacity : NPK Fertilizer (19-19-19): 10 MT Per Day |
Plant and Machinery cost: 69 |
|
Working Capital : N/A |
Rate of Return (ROR): 29 |
|
Break Even Point (BEP): 44 |
TCI :
|
|
Cost of Project : 819 |
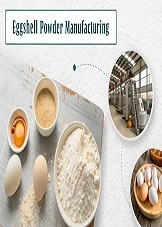
Currently, in the context of green entrepreneurship and the circular economy, the processing of eggshells into a powder represents a promising idea fo...
|
Capacity : 5 MT Per Day |
Plant and Machinery cost: 16 |
|
Working Capital : N/A |
Rate of Return (ROR): 29 |
|
Break Even Point (BEP): 52 |
TCI :
|
|
Cost of Project : 226 |
Liquid Biofertilizer Manufacturing Industry. Production of Liquid Bio-Fertiliser. Profitable Biofertilizers Production Business Ideas Liquid Bioferti...
|
Capacity : - |
Plant and Machinery cost: - |
|
Working Capital : - |
Rate of Return (ROR): 1.00 |
|
Break Even Point (BEP): 0.00 |
TCI : - |
|
Cost of Project : 0 |
Bone meal is a mixture of finely and coarsely ground animal bones and slaughter-house waste products. It is used as an organic fertilizer for plants a...
|
Capacity : - |
Plant and Machinery cost: - |
|
Working Capital : - |
Rate of Return (ROR): 1.00 |
|
Break Even Point (BEP): 0.00 |
TCI : - |
|
Cost of Project : 0 |
Micronutrients are essential elements required by organisms in small quantities throughout life to orchestrate a range of physiological functions to m...
|
Capacity : - |
Plant and Machinery cost: - |
|
Working Capital : - |
Rate of Return (ROR): 1.00 |
|
Break Even Point (BEP): 0.00 |
TCI : - |
|
Cost of Project : 0 |
Water Soluble Fertilizer Manufacturing Industry. Water Soluble Fertilizer Blends Production for Drip Irrigation Systems Water soluble fertilizers are...
|
Capacity : - |
Plant and Machinery cost: - |
|
Working Capital : - |
Rate of Return (ROR): 1.00 |
|
Break Even Point (BEP): 0.00 |
TCI : - |
|
Cost of Project : 0 |
Magnesium Sulphate is commercially available as heptahydrate, monohydrate, anhydrous or dried form containing the equivalent of 2-3 waters of hydratio...
|
Capacity : Magnesium Sulphate (Fertiliser Grade): 24 MT/day |
Plant and Machinery cost: Rs. 147 lakhs |
|
Working Capital : - |
Rate of Return (ROR): 28.00 |
|
Break Even Point (BEP): 56.00 |
TCI : Cost of Project: Rs. 434 lakhs |
|
Cost of Project : 43400000 |
A water soluble fertilizer is a compound that dissolves easily in water and provides nutrients for plants. This type of fertilizer may then be absorbe...
|
Capacity : NPK Fertilizer (19-19-19) (in 5 Kgs Size Pack) : 32 MT/day |
Plant and Machinery cost: Rs. 87 lakhs |
|
Working Capital : - |
Rate of Return (ROR): 28.00 |
|
Break Even Point (BEP): 60.00 |
TCI : Cost of Project: Rs529 lakhs |
|
Cost of Project : 52900000 |

Entrepreneur India, an Industrial monthly magazine on industrial development, technologies & project opportunities aims at simplifying the process of choosing the suitable project for investment.

Entrepreneur India - Copyright 2017-. All rights reserved.